The LiveLike Analytics Dashboard is Available Now!

We’re so excited to announce the most recent update to our CMS: The LiveLike Analytics Dashboard is ready!

Before the launch, we utilized an external solution to gather usage data and share it with clients on an ad-hoc and manual basis. While this was a fine solution in the interim, our dedicated LiveLike Analytics Dashboard means that usage data can now be easily accessed by clients directly on our CMS!
Besides convenience, this also has some other major advantages:
- Apps integrated with LiveLike will be smaller in storage size on devices
- The LiveLike SDK installation process is easier because the project structure is simplified
So, How Does It Work?
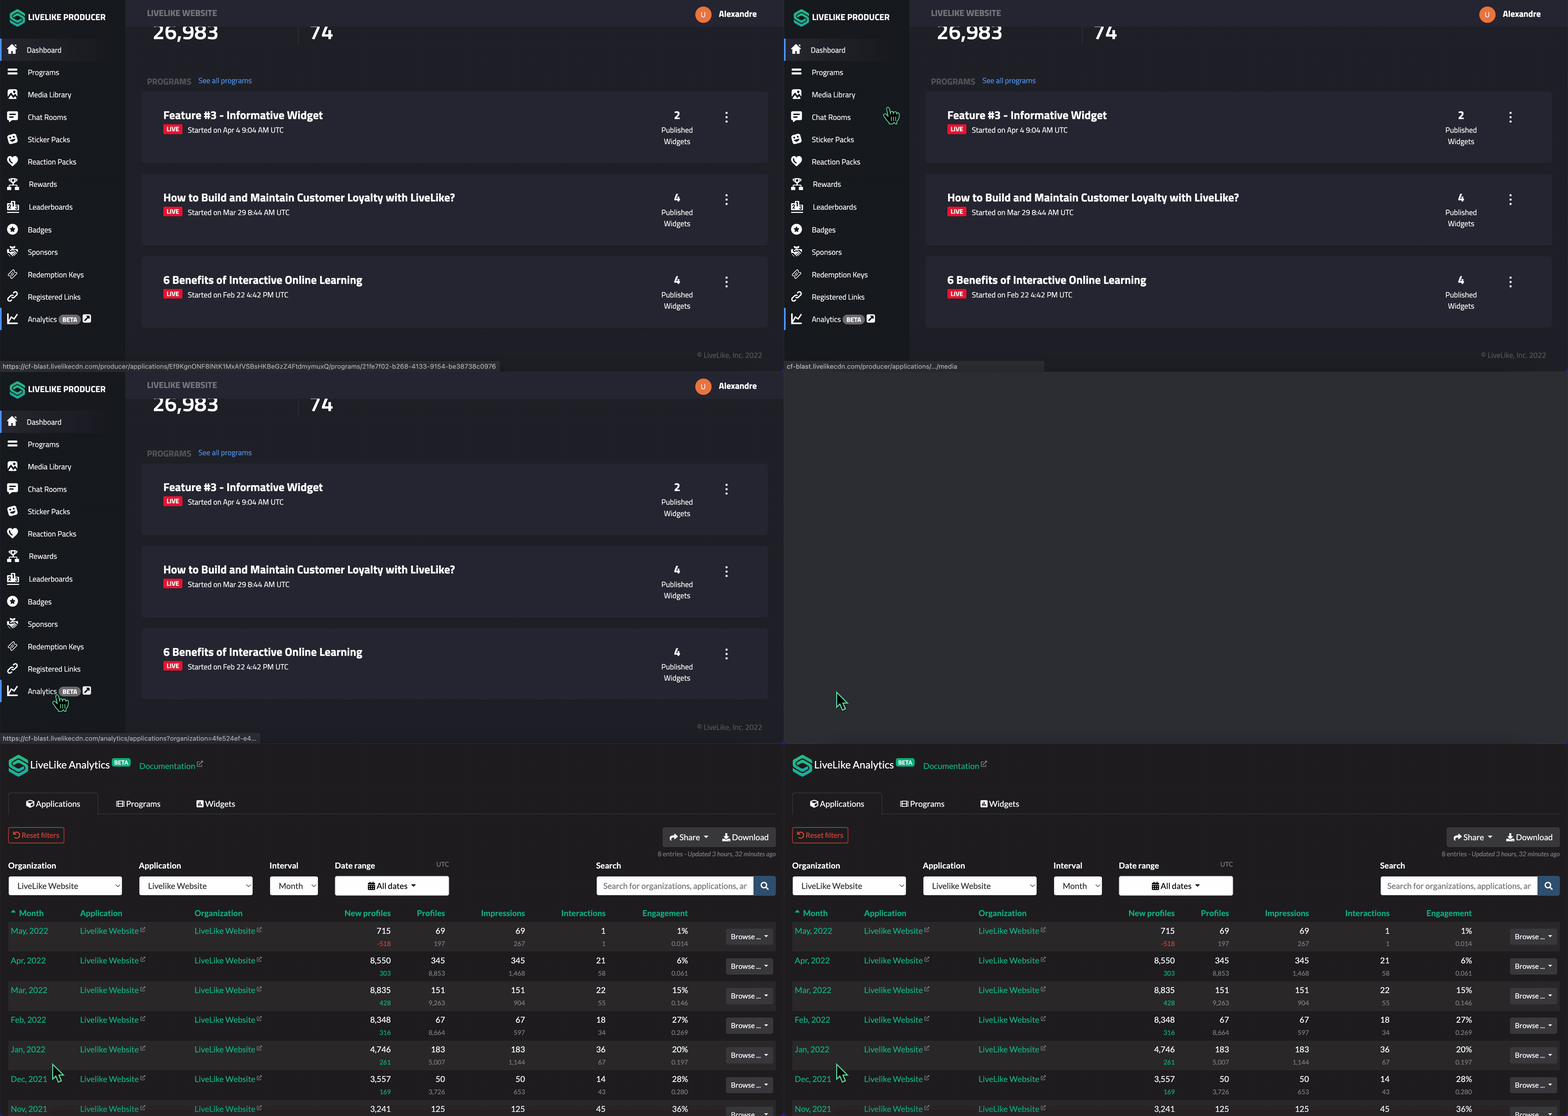
For now, our Analytics Dashboard is composed of three tabs: Applications, Programs, and Widgets.
To see an overview of your application’s performance, simply click on the Applications Tab. You will then be able to access information on Profiles (Total & Unique), Impressions (Total & Unique), Interactions (Total & Unique), and overall Engagement Rate. Unique figures are on top and in white, while Total figures are on the bottom and in grey.

In this example, we are checking the monthly performance of the application “LiveLike Website”. At first, the months are sorted in chronological order but we can rearrange this order to showcase the best months in terms of impressions, interactions, or engagement rates.
If you want to know how a program or widget performed, you simply need to go to these tabs and sort them (programs or widgets) by the number of impressions, interactions, or by engagement rate (depending on your objectives). This will allow you to understand more about your end-users’ expectations. Note that within each of the tabs, you will have several filtering options that will enable you to get to the specific data that matters the most.
What’s Next?
In the coming weeks, we will be integrating Chat Rooms Analytics with metrics such as Total and Unique Messages, Reactions, and an Audience segmentation tab to see which platforms and devices your audience members are using to enjoy your LiveLike features!
If you already have an Analytics Dashboard, you can continue to use Analytics Hooks to send analytics from LiveLike into your own systems.
Still have questions about how you can utilize the Analytics Dashboard to improve fan engagement on your platform? Get in touch today to learn more about how the LiveLike Dashboard can help enhance your user experience.

Written By

Written By


